| SOP Number: | Working Guide |
| Effective Date: | 11/1/2024 |
| Latest Version By: | Leona Choi, HP |
| Approved By: | Rachel Nichols, ARSO |
The purpose of this working guide is to provide the Radiation Safety Staff (RSS), Permitted Individuals (PI) and their secondaries step-by-step instructions on how to calibrate and operate the Beckman 6500 Liquid Scintillation Counter (LSC) commonly found around MU.
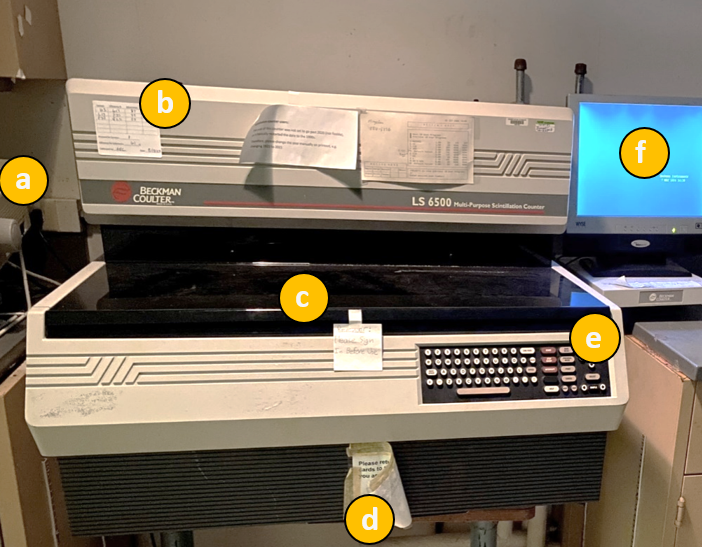
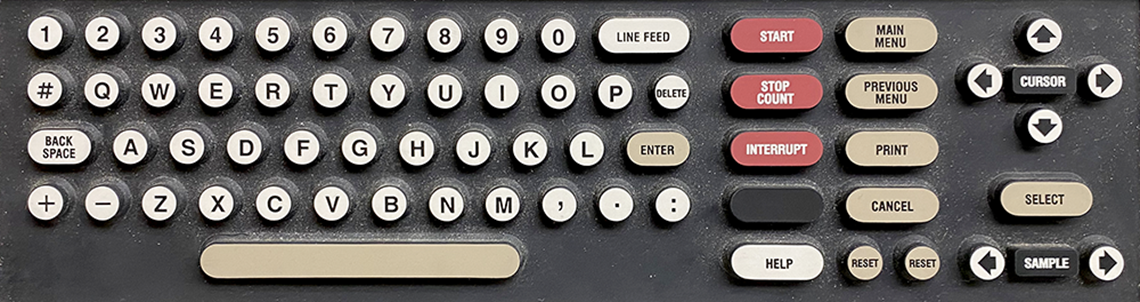
Pictured above is a Beckman LS 6500 located in Schweitzer 17. Important components include: (a) printer, (b) calibration sticker, (c) cover, (d) user program flag drawer, (e) keyboard, (f) monitor. Pictured below is a closer look at the keyboard.
Download the Excel template to follow along with this working guide and enter your data:
- Calibration
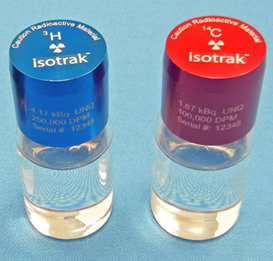
For calibration, you will need a set of 20 ml unquenched standards. This would typically include a background, 3H, 14C, and 32Si (a progeny of 32P).
- On the “MAIN MENU” screen, use the arrow keys to highlight “Review and Edit User Programs” and press SELECT on the keyboard (Fig. 1).
On the “REVIEW / EDIT” screen, use the arrow keys to highlight your counting protocol and press SELECT on the keyboard. In this guide, we are using protocol 4 SWIPES (Fig. 2).
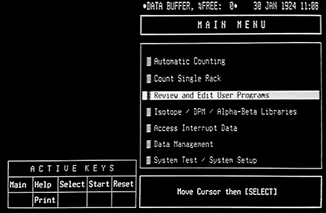
Figure 1. Main menu.
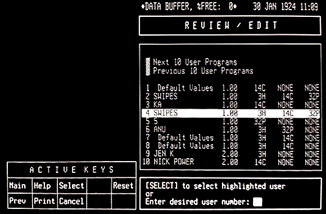
Figure 2. Selecting the user program “4 SWIPES” to edit its settings.
- Verify that the protocol has a count time of 1 minute and the correct isotopes are listed based on the standards you will be using (Fig. 3a). If changes are needed, highlight the appropriate field with the arrow keys and press SELECT. Use the keyboard to input your desired changes and press ENTER to submit the change. To return, press PREVIOUS MENU on the keyboard.
On the “REVIEW / EDIT” screen for the user program, highlight “Edit Other Parameters” and press SELECT (Fig. 3b). Press SELECT again to enter the “Data Calculation” screen (Fig. 5).
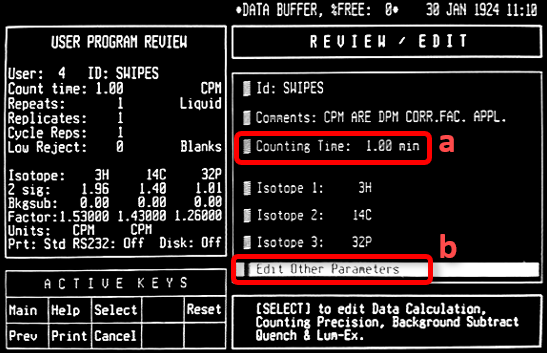
Figure 3. The “Review/Edit” page for the selected user protocol.
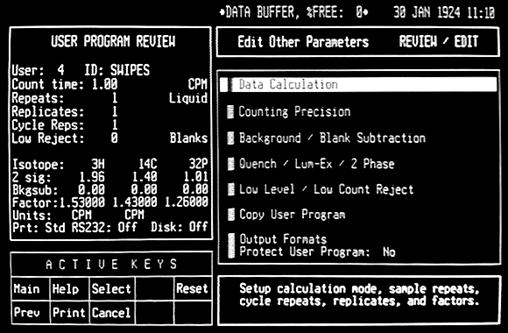
Figure 4. Select “Data Calculation” after you select “Edit Other Parameters.”
- In “Data Calculation,” check that the background subtraction is set to 0 (Fig. 5a). Edit the factors for each Isotope. Use the arrow keys to highlight the isotope, enter a factor of 1, and then press ENTER (Figure 6). Repeat for each isotope then return to the “MAIN MENU” by pressing MAIN MENU on the keyboard.
Load a rack with the standards (left to right) and protocol flag into the right side of the LSC. The order doesn’t matter, but you should be aware of the order you choose since it will be critical for transferring data into the spreadsheet. It is recommended to load the standards by mass number for convenience: background, 3H, 14H, and 32Si. Load another empty rack with the HALT flag following. Note that these flags should be facing away from you. Be sure that the printer is on, and the paper is properly aligned. Shut the LSC lid and press the START button to begin “Automatic Counting” on the Main Menu.
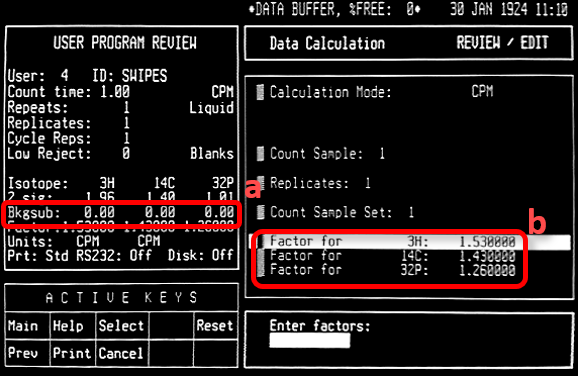
Figure 5. In the “Data Calculation page,” check that “Bkgsub” is set to 0 for each region and set each isotope factor to 1.
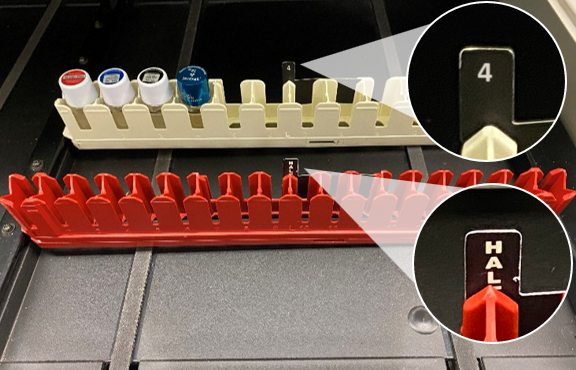
Figure 6. LSC sample racks should be loaded on the right-side, top to bottom. The racks should be oriented such that only the top part of the flag is facing you. Don’t forget the HALT rack!
Next, the data from the counting results will need to be entered to the spreadsheet[†] to calculate the new isotope factors and minimum detectable activity (Fig. 7, 8). Enter the background CPM for each respective isotope region (Fig. 7a). Then enter the data for each standard according to the isotope and region of interest (Fig. 7b). Note that the CPM taken for each sample number corresponds to the isotope standard used in that position. E.g. The 3H standard was placed in the second slot of the rack, so the CPM result we use is in column 3H, row 2 (Fig. 7c, d).
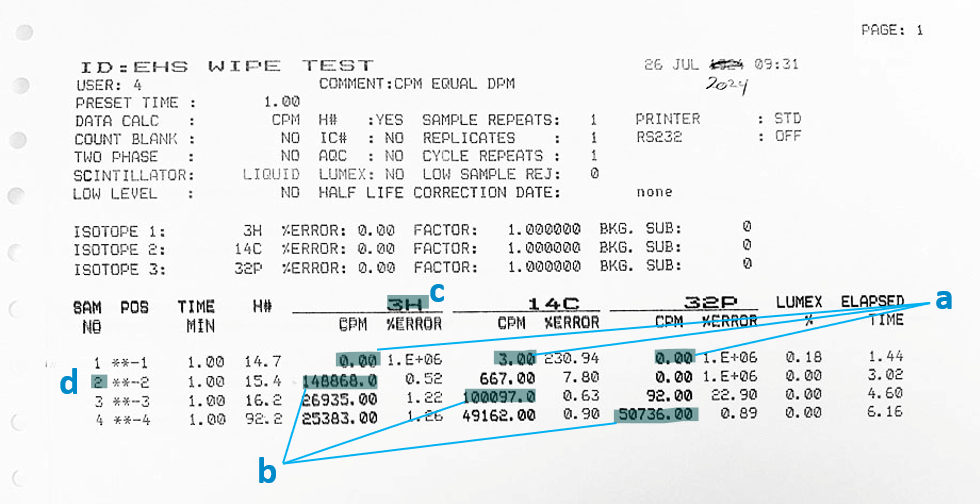
Figure 7. Counting analysis print-out results: (a) contains the background counts for each isotope region, (b) contains the CPM taken for each isotope region with respect to the sample number, (c) shows the isotope region column headers.
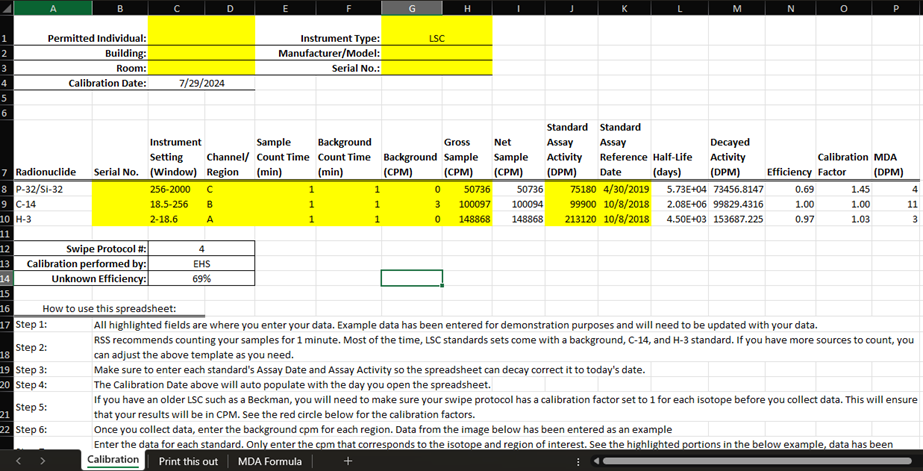
Figure 8. This spreadsheet calculates the calibration factors (Column O) based on the counting efficiencies (Column N).
- Check the following spreadsheet calculations: Efficiencies (Column N) are ≤1, and Calibration Factors* (Column O) are ≥1, MDAs (Column P) are <200 dpm. *Note: Calibration factors are calculated as the inverse of the efficiency.
- If the data looks good, press MAIN MENU and steps 1.2 – 1.5 to navigate back to where you can enter the new calibration factors for each isotope. The calibration is then complete.
- It can be useful to create a “calibration sticker” where you can record the efficiencies for each region, the date of calibration, and the name or initials of the person that performed the calibration. Some form of calibration information should be on the equipment.
- Be sure to send your calibration print-out to EHS so radiation safety may update your LSC’s records.
- Counting
- Once an LSC is within calibration, it can be used to analyze contamination swipes. Depending on the location of the LSC and the supplies available, you may need to prepare your vials in advance. Be sure to have a blank vial for background counts.
- Load the sample vials from right to left, beginning with the blank vial.
- Insert the protocol flag designated for counting on the first rack only. load your samples into the rack(s). From the “MAIN MENU” window, highlight “Automatic Counting” and press the START button.
Troubleshooting
- Cancel analysis/counting:
- To interrupt the counting process, simply press
 on the keyboard.
- To interrupt the counting process, simply press
- Reset:
- If the LSC is unresponsive, you can do a soft reset by pressing
 simultaneously.
- If the LSC is unresponsive, you can do a soft reset by pressing
- Cancel analysis/counting: